
Read your scan results
Issues, suggestions, severity levels, the trend chart and the full report.
Every finished scan produces three views of the same data: the summary on the site's Issues tab, the full findings list below it, and a detailed report you can open or download. Start with the summary.
The executive summary
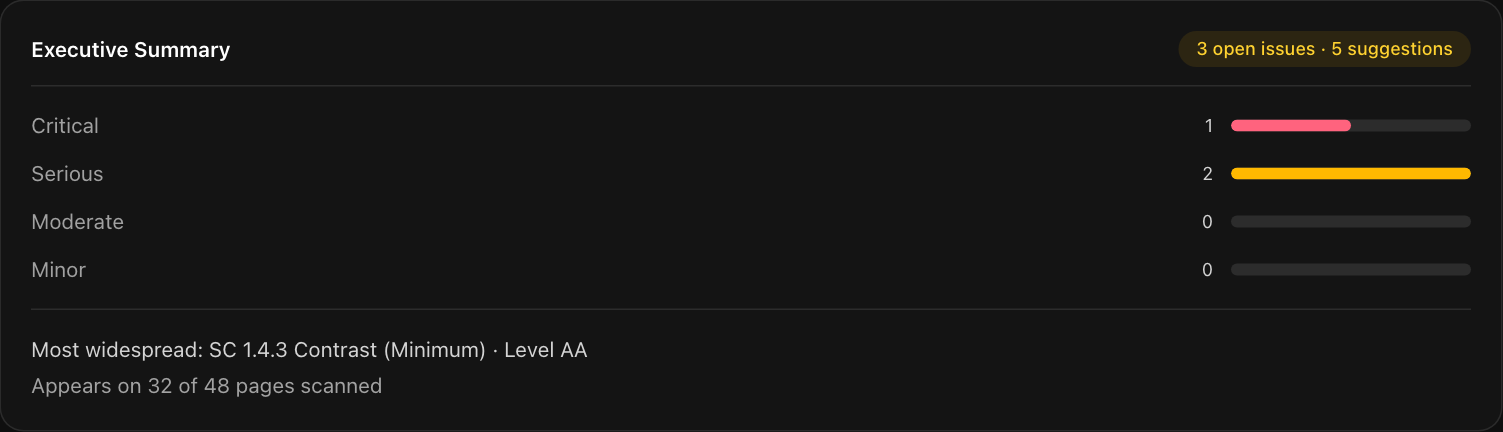
The summary shows open issues and suggestions as two counts, then a bar for each severity level. It counts issues, which are explained in the next section:
| Severity | What it usually means for a visitor |
|---|---|
| Critical | A feature is blocked for some people, for example a control that assistive technology cannot operate. |
| Serious | A significant barrier, such as text that is hard or impossible to read. |
| Moderate | Makes the page harder to use but usually has a workaround. |
| Minor | A small annoyance or a best-practice gap. |
A line below the bars names the most widespread problem and how many of the scanned pages it appears on. That is often the best place to start, because one fix in a shared template can clear it everywhere.
Issues and findings
Two words show up in the results, and they count different things:
- Issue is one kind of problem, such as "text contrast is too low". The Issues tab, the summary and the four principles all count issues.
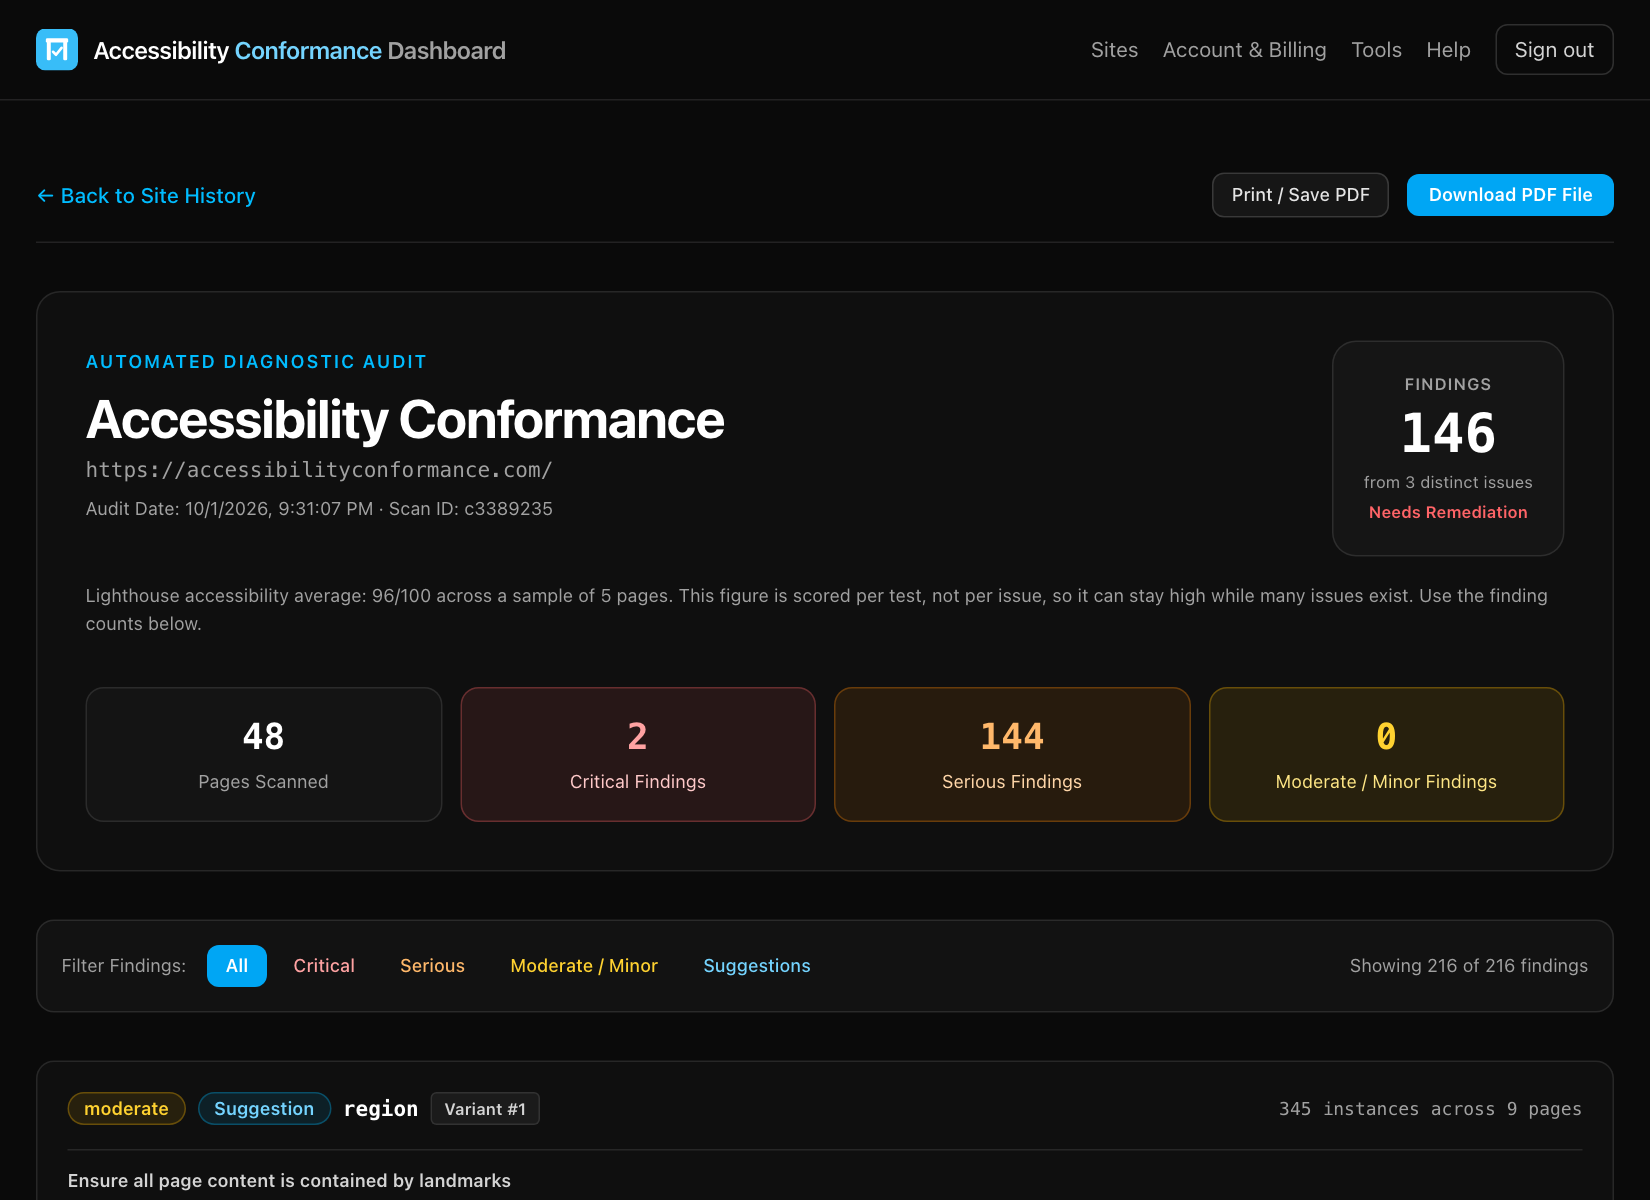
- Finding is one place where an issue shows up, such as one particular button or one group of similar elements. One issue usually has many findings. The dashboard card, the scan history, the HTML report and the PDF count findings. A published statement gives both numbers.
For example, "3 open issues spread across 146 findings" means three kinds of problem, repeated in 146 places. Fixing a shared template often clears many findings at once, so the number of issues is the better measure of how much distinct work is left. Client Mode shows both numbers in one sentence.
The four principles
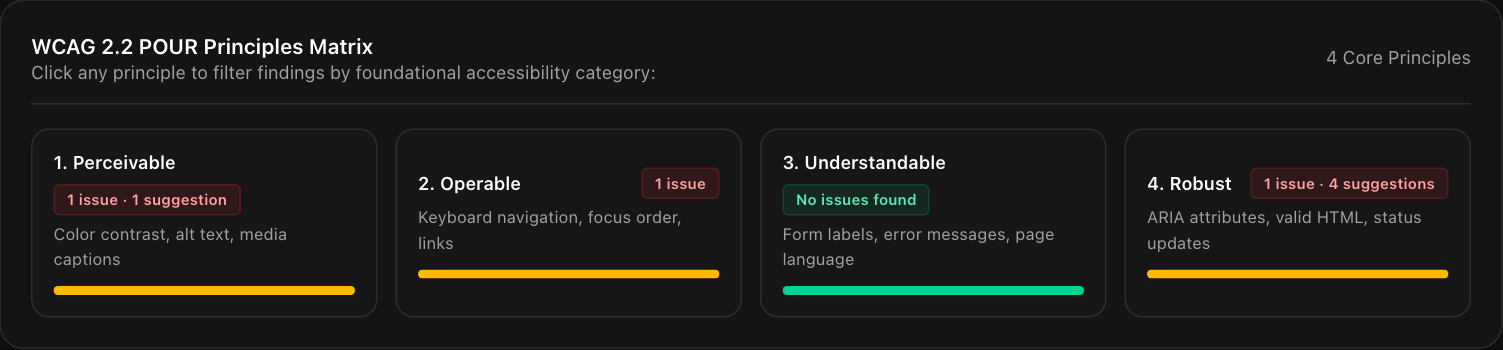
WCAG organizes its requirements under four principles: Perceivable (people can see or hear the content), Operable (people can use controls and navigation), Understandable (content and behavior are clear) and Robust (it works with assistive technology). Select a box to filter the findings list to that principle.
The trend chart (Pro)
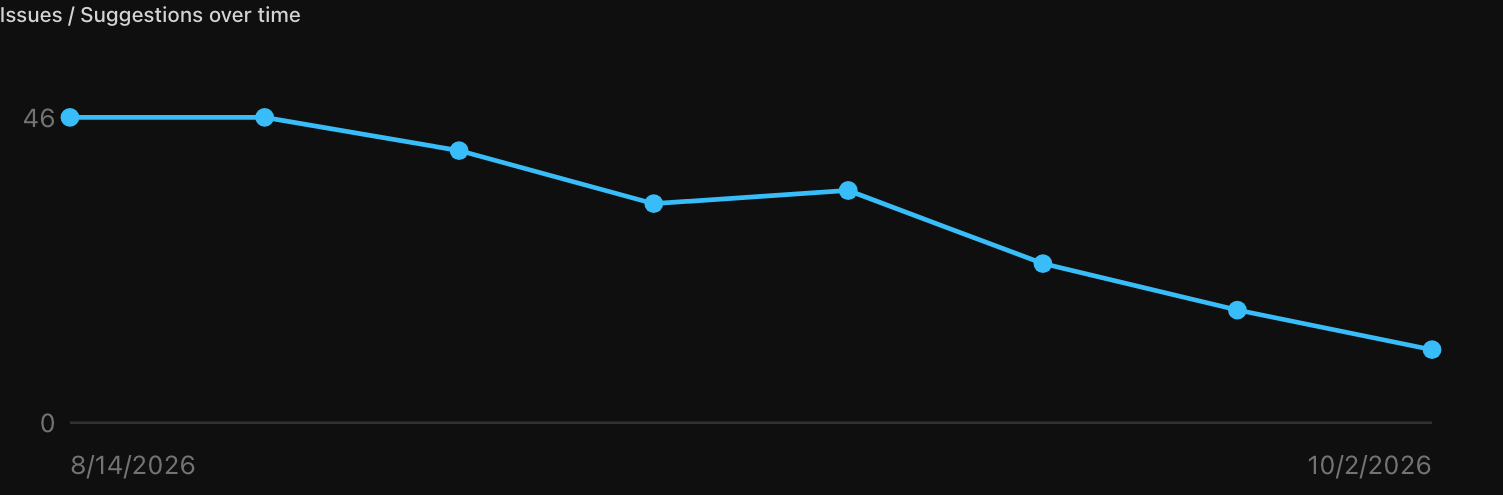
The chart plots the number of issues and suggestions found by each scan, so you can see whether your work is paying off. A drop after a release is the result you want. A rise means new content or code introduced new problems. The trend dashboard is part of the Pro plan.
The findings list
Below the charts, findings are grouped by rule. Each row shows the severity, the rule name, the WCAG criterion it relates to, how many of the groups are still open, and how many times it occurred in total. "Suggestion" rows are best-practice items rather than WCAG failures. For how to work through the list, see work through and track fixes.
Scan history and reports
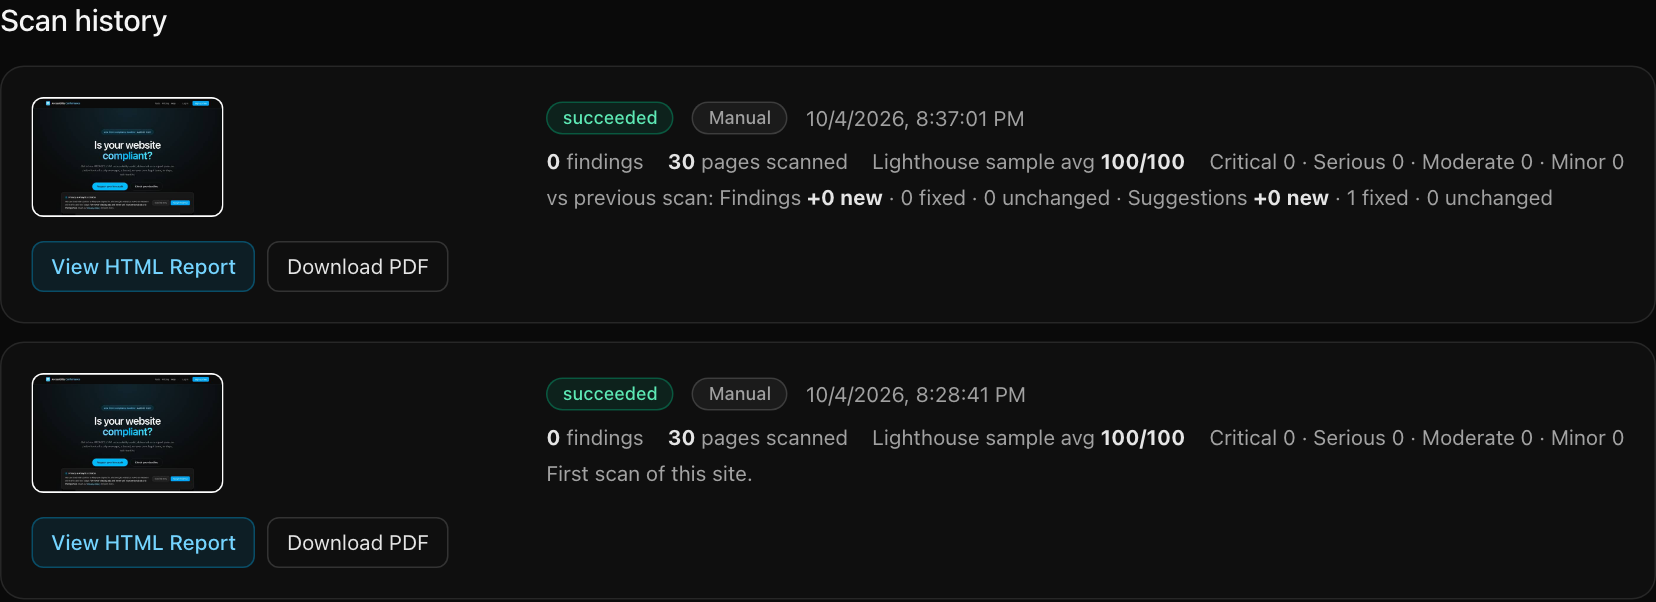
Each past scan shows its date, how it was started (manual or scheduled), the number of findings by severity and a comparison with the scan before it:
- New findings were not in the previous scan.
- Fixed findings were in the previous scan and are gone.
- Unchanged findings are present in both scans.
Select View HTML Report to open the full report in your browser, or Download PDF for a copy you can attach to an email or share with a client.
Still stuck? Contact us with your site address and what you expected to happen.